Blog Right Sidebar

Jim Simons Trading  Strategy  explained

Jim Simons Trading Strategy explained

Jim Simons is a mathematical physicist and hedge fund manager who is best known for his quantitative trading strategy. His firm, Renaissance Technologies, uses complex mathematical models to identify profitable trading opportunities in the financial markets.

James Harris "Jim" Simons is an American mathematician, hedge fund manager, and philanthropist. He is the founder and former chairman of Renaissance Technologies, a quantitative investment management firm.

Simons received his Ph.D in mathematics from the University of California, Berkeley in 1961. He then worked as a mathematics professor at MIT and Harvard before moving to the private sector. In 1982, he founded Renaissance Technologies, which uses mathematical models and algorithms to analyze and execute trades. The firm's flagship Medallion Fund is one of the most successful hedge funds in history, achieving an annualized return of over 30% for over two decades.

Simons is known for his investment acumen and is considered one of the most successful hedge fund managers of all time. He has been consistently ranked among the highest-earning hedge fund managers and has a net worth of over $23 billion as of 2021.

Simons is also known for his philanthropy. He has donated millions of dollars to various causes, including education, science, and healthcare. He established the Simons Foundation, which supports research in mathematics, theoretical physics, and the life sciences.

In addition to his business and philanthropic endeavors, Simons is also a patron of the arts and has donated to cultural institutions and charities. He is a member of the Board of Trustees of the Institute for Advanced Study in Princeton, New Jersey and a Trustee of the Museum of Modern Art in New York City.


The main elements of Simons' trading strategy include:

  1. Statistical Arbitrage: Renaissance Technologies uses statistical arbitrage, which involves identifying statistical patterns in market data and using that information to make trades. This approach looks for inefficiencies in the market and seeks to exploit them.

  2. Algorithmic Trading: Renaissance Technologies uses complex algorithms to analyze market data and execute trades. These algorithms are designed to identify profitable trading opportunities and make trades quickly and efficiently.

  3. High-Frequency Trading: Renaissance Technologies uses high-frequency trading (HFT) to make rapid trades in large volumes. This allows the firm to take advantage of small price movements in the market and make large profits.

  4. Machine Learning: Renaissance Technologies also uses machine learning techniques to analyze market data and identify profitable trading opportunities.

  5. Risk Management: The firm has a strong risk management process in place to minimize losses and maximize returns. The firm uses mathematical models to identify and hedge risks.

  6. Short-term trading: Renaissance Technologies is known for its short-term trading. The firm's flagship fund, Medallion Fund, which is open only to Renaissance employees, is one of the most successful hedge funds of all time, with returns of more than 35% per year, net of fees, since its inception in 1988.

In summary, Jim Simons' trading strategy is a quantitative approach that uses advanced mathematical models, algorithmic trading, high-frequency trading, and machine learning to identify profitable trading opportunities in the financial markets. The firm also has a strong risk management process in place to minimize losses and maximize returns. It is known for its short-term trading, which has been highly successful.


5 Quotes of  Jim  Simons

  1. "The most important thing is to find people who are smart, who are curious and who are willing to take risks."

  2. "The best ideas come from people who are not experts in the field."

  3. "If you're not willing to react with equanimity to a market price decline of 50% two or three times a century, you're not fit to be a common shareholder, and you deserve the mediocre result you're going to get compared to the people who do have the temperament, who can be more philosophical about these market fluctuations."

  4. "The most important thing is to be able to learn from your mistakes, and to learn from your successes."

  5. "The key to our success has been the ability to attract and retain talented people and to provide them with the tools and resources they need to be successful. We have always believed that the best ideas come from people who are not experts in the field, and we have worked hard to create an environment that encourages creativity and innovation."


How  Google  trend  can  help you  in  trading

How Google trend can help you in trading

A trading strategy that incorporates the Google Trends factor involves analyzing the volume of Google searches for a particular stock or sector, and using that information to inform buy or sell decisions. Here's a more detailed explanation of how this strategy could be implemented:

  1. Identify the stock or sector you want to trade. This could be a specific company or a group of companies in a particular industry.

  2. Use the Google Trends website to retrieve the historical data of how often that stock or sector has been searched for on Google. The website provides data on the search volume for a specific term over a certain period of time. It also allows you to compare the search volume for multiple terms at the same time.

  3. Plot the Google Trends data on a chart alongside the stock or sector's price chart. This will allow you to visually compare the two sets of data and look for correlation.

  4. Look for correlation between the two charts. If the stock or sector's price tends to rise when Google search volume is high, it may indicate that investors are becoming more interested in the stock, which could be a bullish sign. Conversely, if the stock or sector's price tends to fall when Google search volume is high, it may indicate that investors are becoming less interested in the stock, which could be a bearish sign. Keep in mind that correlation does not imply causation and other factors should be considered.

  5. Use this information to make informed buy or sell decisions. For example, if Google search volume is high and the stock or sector's price is also rising, it may be a good time to buy. If Google search volume is high but the stock or sector's price is falling, it may be a good time to sell.

  6. Keep in mind that this strategy is not a guarantee of success and it's important to always use it alongside other technical and fundamental analysis. It's also important to note that Google Trends data is based on the volume of Google searches, which does not necessarily indicate buying or selling interest in a stock. Therefore, it's important to complement this data with other analysis methods. Furthermore, the strategy should be tested over a period of time and backtested to understand its performance.


Here's an example of how a trader might use the Google Trends factor in a trading strategy:

Let's say a trader is interested in trading the technology sector, specifically in a company named XYZ. They begin by identifying the stock they want to trade and then use the Google Trends website to retrieve the historical data of how often the term "XYZ" has been searched for on Google.

The trader plots the Google Trends data on a chart alongside the stock's price chart. They notice that the search volume for "XYZ" tends to increase before the stock's price rises, and decrease before the stock's price falls. They also notice that the search volume for "Technology sector" also tends to increase before the stock's price rises.

Based on this analysis, the trader decides to buy XYZ stock when the Google search volume for "XYZ" and "Technology sector" is high and rising. They also set stop loss order in case the trend is not confirmed.

As an example, let's say the Google search volume for "XYZ" and "Technology sector" increased significantly in the last week and the trader decide to buy the stock. In the following days, the stock's price rises and the trader decides to sell their shares and make a profit.

It's important to keep in mind that this is just an example and past performance is not a guarantee of future results. It's important to always use this strategy alongside other technical and fundamental analysis and backtest it over a period of time to understand its performance.

Commodity Channel Index (CCI) Trading Strategy

Commodity Channel Index (CCI) Trading Strategy


Hello, folks today I want to show you a strategy based on Commodity Channel Index (CCI) Indicator.


What is the Commodity Channel Index (CCI)?

 The Commodity Channel Index​ (CCI) is a momentum-based oscillator used to help determine when an investment vehicle is reaching a condition of being overbought or oversold.


                                                         image


Developed by Donald Lambert, this technical indicator assesses price trend direction and strength, allowing traders to determine if they want to enter or exit a trade, refrain from taking a trade, or add to an existing position. In this way, the indicator can be used to provide trade signals when it acts in a certain way.

I will use the simple rules for the strategy:

KEY TAKEAWAYS

-IF CCI -140 ENTER LONG, IF LAST 5 HIGHS OF THE BAR BELOW EMA 20
Enter long position
-IF CCI ABOVE 140 ENTER SHORT, IF LAST 5 LOWS ABOVE EMA 20
Enter short position

STOP: 1000 USD
TAKE: 5000 USD

Instrument BTCUSD


image


This is how automated strategy is looking on the chart.

Now let’s make some magic with backtesting of the strategy.


image


As we see above during 2 years of trading strategy made over 32k USD. We can’t say that the equity performance was perfect,                                                                                                                but at least strategy showed a profit in these difficult market conditions.

Lets look at Performance summary ($)


image

As we see above simple strategies are exist !)

The best trading strategy in the world won’t do you any good if you allow emotions to trump logic


PRICE: 70 USD


Pls contact us:  This email address is being protected from spambots. You need JavaScript enabled to view it.


BUMBERSHOOT PATTERN (INVERTED UMBRELLA)

BUMBERSHOOT PATTERN (INVERTED UMBRELLA)

BUMBERSHOOT PATTERN (INVERTED UMBRELLA) - Was created by Tokmurzin Askar as he discovered this pattern by him self after many years of trading.  This pattern signalling  for a good and strong impulse 

move and at the end it will look completely  like inverted umbrella.  

BUMBERHOOT EXAMPLE: MU US the picture above showing a perfect setup where the last move must be impule one  and confirming the pattern structure. 

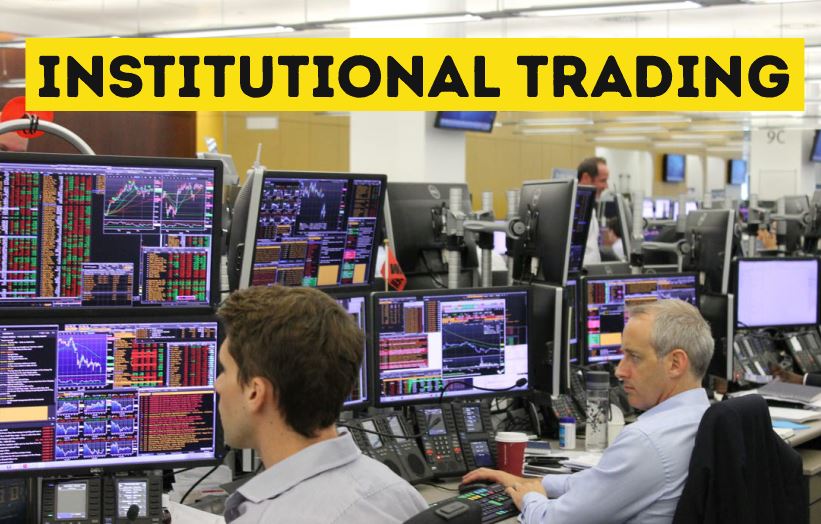
Most sophisticated Institutional trading algorithms for market-making, order execution and trading.

Most sophisticated Institutional trading algorithms for market-making, order execution and trading.

Today we want to show the most sophisticated Institutional algorithms that is used by large institutional clients for market-making, order execution and trading.  


EXECUTION ALGORITHMS FOR MAKING LESS IMPACT TO MARKET

Iceberg (Iceberg)

An algorithm that dispenses orders . Of the true order quantity, only a part is shown on the board, and when the order placed on the board is executed, the next order is placed.

Stealth


Don't put your order on the board, but take it when you get an order for the price you want to buy on the board.

Pegging

An algorithm that places a limit order that is a certain value or a certain percentage away from the best quote, and follows it when the best quote fluctuates . Sometimes used for market making.

Layering

Place limit orders distributed across multiple prices in order to take a high priority position within each price .

Liquidity Driven Order

Monitor the liquidity of the board and place an order when the liquidity exceeds a certain level.

SOR (Smart Order Rouiting)

Place orders from multiple markets to the best market.


 BENCHMARK EXECUTION ALGORITHM-AN ALGORITHM THAT BRINGS THE EXECUTION RESULT CLOSER TO SOME KIND OF BENCHMARK USED BY INSTITUTIONAL INVESTORS FOR LARGE ORDERS. 

TWAP (Time-Weighted Average Price)

An algorithm that equalizes in time and places an order . Place an order by dividing the quantity you want to trade at equal time intervals.


VWAP (Volume-Weighted Average price)

An algorithm that aims to bring your VWAP closer to the market VWAP . In many cases , the volume is normalized by the volume distribution during the day and the quantity is sliced ​​before ordering.POW


POV(Percentage of Volume)

Place an order so that it accounts for a certain percentage of the market volume .


PI (Price Inline)

A modified version of VWAP. If the current price is smaller than VWAP, order a larger quantity, and if it is larger, order a smaller quantity.


MOC (Market on Close)


An algorithm that aims to bring its VWAP closer to the closing price of the market .


IS (Implementation Shortfall)


An algorithm that benchmarks the market price at the time of buying and selling decisions .


MARKET MAKING ALGORITHM-ALGORITHM USED FOR MARKET-MAKING . PLACE BOTH BUY AND SELL ORDERS ON THE BOARD.


See market mid-market price


Determine your order price by referring to the market mid-market price.


Market price interlocking


Take the limit order left behind when the board situation changes and the price moves to either side .


Utilization of market liquidity


If there is a large order for another participant on the board, place an order in front of it.


ARBITRAGE ALGORITHM-MAKE RULING BY PAYING ATTENTION TO THE DISTORTION OF THE MARKET. 


Same product arbitrage


If the same product is traded in multiple markets, the price difference is determined.


Theoretical ruling


For objects such as derivatives for which the theoretical price can be calculated according to a model such as the financial price, the price difference from the theoretical price is determined.


Statistical ruling


Arbitrate statistical distortions that other market participants are unaware of.


DIRECTIONAL ALGORITHM-PREDICT PRICE MOVEMENTS AND ACTIVELY TAKE MARKET RISK.


Trend Following


We will trade with the expectation that the trends that occurred at the past will continue in the future.


Momentum Traing


Make transactions that take advantage of short-term momentum.


MEAN REVERSION-TRADE THE HOPE THAT THE PRICE WILL RETURN TO EQUILIBRIUM WHEN THE PRICE FLUCTUATES TOO MUCH. 


Range Trading


Trade with the expectation that the price will move within a certain range.


News / Event Driven


Transactions are triggered by stock price movements such as corporate news and announcements of indicators.


MARKET OPERATION ALGORITHM-AIM TO MANIPILATE THE MARKET BY INDUCING THE OTHER PARTICIPANTS. IT MAY CONTAIN ILLEGAL ELEMENTS.

Front Running


The broker uses the order information from the customer to buy and sell in his own favor .


Spoofing


Place large orders at multiple prices and mislead other investors' forecasts.


Strike robbing (Strobing)


Placing an order on the board for a moment misleads other participants' predictions.


Momentum Ignition


Placing an order in a specific direction misleads other participants' predictions.


Stop Loss Ignition


Induce price movements by aiming for stop loss orders from other investors.


Push the Elephant


When there is a large order on the board that seems to be willing to buy or sell, induce a large order by updating the best quote with your own order.


Gaming


Update the best quote on your order and manipulate the price of the dark pool referring to the quote.

Swing Trading With Three Indicators by Donald Pendergarst

Swing Trading With Three Indicators by Donald Pendergarst

Hello folks

Today I want to show u system of Donald Prendergast that was explained in in the December 2013 in journal "Stocks and Commodities "

Donald Pendergast

Donald Pendergast has studied technical price charts and market dynamics for more than 30 years and has had more than 1,000 articles on technical analysis, trading system development, and high-probability chart setups published at several trading/investing publications since 2008. Pendergast offers real-world trading signals for a basket of eight gold/silver mining stocks/ETFs and also offers high-quality, customized analysis for US stocks. 


A SIMPLE AND VISUAL SYSTEM
Here's a look at my simple, visually based "trading with the trend" system that is nonoptimized, noncurve-fitted and is a no-brainer to construct and maintain. The key ingredient for success in trading with this template is you, because there are no secret market indicators or forecasting tools that can guarantee you trading success. But this no-cost trading template that is easy to construct will help you stay on track with the mental and emotional discipline needed to learn to trade profitably. After that, you may want to further fine-tune it by obtaining education in other market dynamics like relative strength analysis, money management techniques, price cycle studies, or wave analysis.

THE RIGHT CANDIDATES
Before you begin, you first need to locate stocks and ETFs that tend to make relatively smooth, regular swing and/or trending moves (up or down, and preferably balanced over long periods of time) if you expect to achieve success with this system. In other words, look for volatile (high-beta), high-volume stocks from sectors and industry groups that tend to go on a bullish/bearish tear several times per year, and which don't spend too much time chopping around in directionless funks. Fast-moving, news-driven technology, mining, financial, or energy stocks are likely to be good hunting grounds for such desirable issues; you'll likely want to avoid sluggish markets like electric utility stocks or other highly regulated public service issues that tend to trade within small ranges most of the time.


UNO, DOS, TRES
The daily chart of Citigroup (C) in Figure 1 shows the three-indicator trading template; this was created using three standard indicators in TradeStation 9.1 (see Figure 2):

 A 50-day exponential moving average (EMA; blue line)
A five-day simple moving average of the daily highs (SMA; gold line)
A five-day simple moving average of the daily lows (SMA; red line)


The trading logic is very simple:


Long entry:

Go long when price exceeds the upper (gold) moving average of the daily highs by five ticks (0.05) and the price bar prior to the break of the upper moving average has closed above the blue 50-day EMA. (Note: If trading low-priced or high-priced stocks, you may want to decrease/increase the five-tick parameter as needed, since five ticks in a $300 stock is a much smaller entry filter amount than five ticks in a $40 stock, so adjust accordingly).
Once you are in a long trade, use the lower (red) moving average of the daily lows as your initial/trailing stop-loss for the life of the trade. Aggressive traders can use the low of the entry bar as the initial stop, but this will sometimes result in premature stop-outs and will entail extra commissions and effort; newer traders should just use the red line as the initial/trailing stop to keep things simple.

Short entry:

The rules for short entry are simply the inverse of the long entry setup.


MOVING FORWARD, SLOWLY
The simulated test results aren't too shabby overall; the system made money on both sides of the market, although more on the long side. The closed trade drawdown was decent, and the profit factor was exceptionally good. Winners were much larger than losers on average, and there were no "catastrophic" losing trades -- a major plus. This means the model has good overall risk control even as it allows winning trades sufficient breathing room to develop.
Of course, this is just a sample trading strategy and no one knows if it will continue to perform as well as this in the future, but you can alter it, fine-tune it, automate it, add multiple exits, or just run it as-is, being sure to select a suitable, diverse universe of stocks or ETFs to trade it with.
Try using a longer or shorter EMA as your trend-confirmation line. Consider using, for example, a 21- or 30-day EMA to generate more trading opportunities, or perhaps an 80- or 100-day EMA to slow things down a bit. You can accomplish much of the same thing by lengthening/shortening the moving averages of the daily highs and lows, too. You can even control the dollar/share allocations by limiting your maximum account risk to perhaps 2% per trade or 0.75% to 1% per trade if you are trading it with a portfolio of six or more stocks. The possibilities for further development of this system are limited only by your understanding of the financial markets, trading skills, imagination, creativity, account size, and confidence level.


 Original and full story:http://premium.working-money.com/wm/display.asp?art=840


RISK WARNING:

Past performance is not necessarily an indicator of future performance.

These results are based on simulated or hypothetical work results, which have certain inherent limitations. Unlike the results shown in the real performance report, these results do not reflect real trading. In addition, since these transactions have not actually been completed, the results may not be adequately or excessively offset by the influence, if any, of certain market factors, such as lack of liquidity. Modeled or hypothetical trading programs in general are also subject to the fact that they are developed based on previous indicators. None of the reported system performance reports guarantee that any account will achieve the same profit or loss ratio close to those shown.

 In addition, hypothetical trading does not involve financial risk, and the indicators of a non-hypothetical trading report cannot fully take into account the impact of financial risk in actual trading. For example, the ability to sustain losses or adhere to a certain trading program, despite trade losses, is a significant factor that can adversely affect the actual results of trading. There are many other factors related to the markets as a whole or to the implementation of any particular trading program that cannot be fully taken into account when preparing hypothetical results, each of which can adversely affect the actual results of trading.

Futures and forex trading contains substantial risk and is not for every investor. An investor could potentially lose all or more than the initial investment. Risk capital is money that can be lost without jeopardizing ones’ financial security or life style. Only risk capital should be used for trading and only those with sufficient risk capital should consider trading. Past performance is not necessarily indicative of future results.