The Halloween indicator- Gerald Gardner
Also known as “Sell in May and go away,” is a well-known seasonal strategy that investors apply to the financial markets. This strategy was introduced by Gerald Gardner in October 2012 "Stocks & Commodities" magazine.
Halloween indicator
The Halloween indicator is a famous anomaly in stock market cycles. A problem with using anomalies in the real world is that they can quit working at any time. For the anomaly to be useful, it must persist and continue despite its well-publicized results.The Halloween anomaly has been analyzed since 1964. Emerging markets and other shorter time series have been studied since 1969. One study testing the Halloween indicator in US equity markets over a 21-year period (April 1982 to April 2003) using futures data verified the presence of a significant effect. The findings led researchers to conclude that the indicator was an “exploitable anomaly” in the US during that time period. That these studies have been published and yet the anomaly persists is a good sign that it will continue.
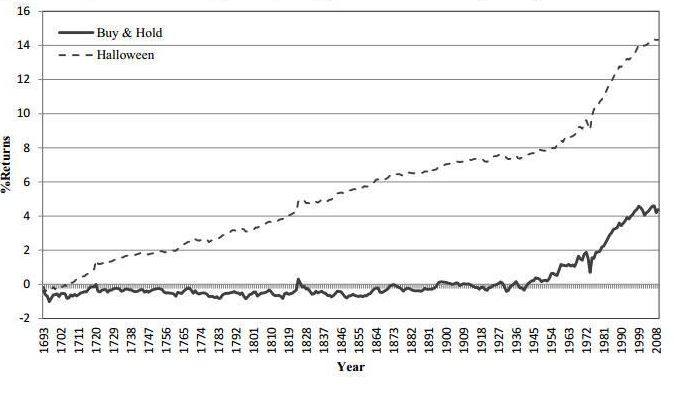
The exploitation of the Halloween indicator is a simple and effective strategy. The stocks are purchased on October 1 then retained until May 1 of the following year. Research has indicated that in buying the Standard & Poor’s 500 and holding from 2001 to 2010, the portfolio would have gained about 7% over this period. A buy & hold strategy would have produced -1%

TRADING LOGIC:
IF PRICE IS ABOVE 50 SMA IN OCTOBER- BUY
CLOSE POSITION IN MAY
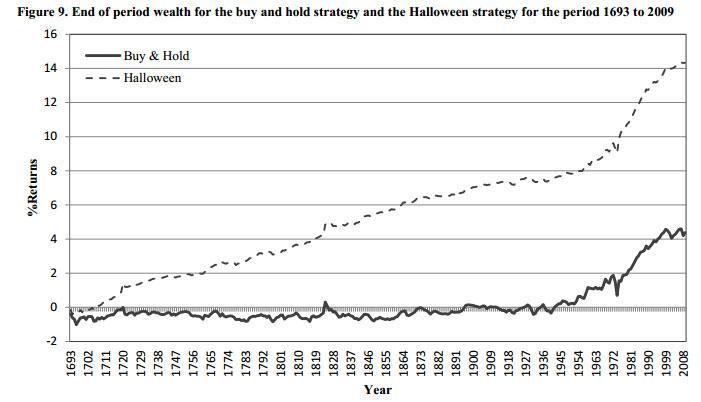
CHART: GRAPH ABOVE SHOWING HOW SIMPLE STRATEGY
OUTPERFORM THE MARKET (SOURCE SEEKING ALPHA)
Putting the Halloween Indicator to the Test
Market anomalies - especially well-known ones like the Halloween Strategy - rarely last. They are quickly arbitraged away as soon as they become widely known. Yet, the Halloween Indicator has stood the test of time.
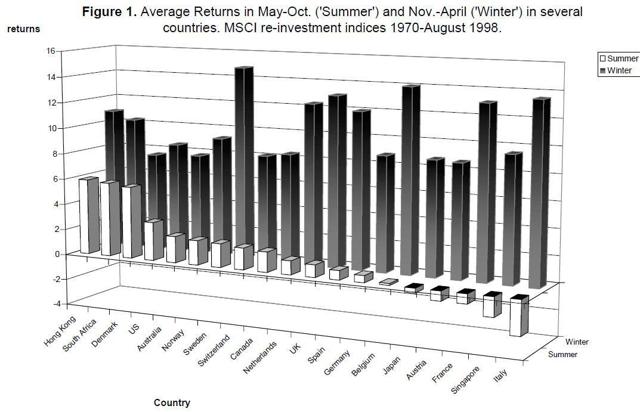
A seminal paper published by Bouman and Jacobsen in 2001 in the American Economic Review confirmed that U.S. stocks outperformed between November to April. Looking at the data between 1970 and August 1998, the Halloween effect was much stronger in almost all other countries.
As the paper put it:
"Surprisingly, we find this inherited wisdom to be true in 36 of the 37 developed and emerging markets studied in our sample. The 'Sell in May' effect tends to be particularly strong in European countries and is robust over time. Sample evidence, for instance, shows that in the U.K., the effect has been noticeable since 1694."
Jacobsen followed up with another academic paper, published in October of 2014, which expanded on the original work from 2001 and updated the data. The paper found that the "best six months" or "Halloween Indicator" strategy had statistically significant outperformance in all 108 out of 109 active stock markets in the world.
Full articles:http://technical.traders.com/archive/archivelogin.asp?file=\V30\C10\401GARD.pdf&src=SC
https://seekingalpha.com/article/4118841-use-this-scary-indicator-to-trounce-u-s-stock-market